
Author: Ken Gray
Editors: Chris Forbes & Diane Bull
 |
Download PDF |
This Sketch examines the history of the weather records and recording at Mission Beach.
The Bureau of Meteorology has a weather station at Bingil Bay for rainfall. It has been operating since 1925, and the Cutten family were the first to take readings at Bicton. The measurements are made manually by private people, whereas most BoM weather stations are automated and measure more than rainfall. Data from this station (number 032009) is readily accessible on the Bureau’s website at:
http://www.bom.gov.au/jsp/ncc/cdio/weatherData/av?p_nccObsCode=136&p_display_type=dailyDataFile&p_startYear=&p_c=&p_stn_num=032009
The 95-year BoM history is charted below (page 2) and shows our average annual rainfall is 3,070mm. We have an average of 145 rainy days each year when we receive 1mm or more in a day. There are usually between 100 and 180 rainy days, and the most were recorded in 2010 (209 wet days).
A wet year for us is when we have over 4,000mm and that has happened ten times in the full record. A very wet year is 5,000mm or more and that has only occurred twice; in 1981 and 2000. A dry year is below 2,000mm which has happened five times and a very dry year is below 1,750mm which has happened twice in 96 years (1,512mm in 1932 and 1,672mm in 1961). In 1902, the Cuttens spoke of a bad drought with only 1,520mm for the year.
A day of 100-200mm rainfall will happen on average four days a year. A day with 200-300mm will happen a little less than once a year. 300mm or more in 24 hours happens about once in 12 years but up until May 2020 that did not happen for 29 years. A 400mm day is rare and has only occurred twice in 95 years so far (435mm in February 1991, 401mm in February 1927).
If we have a ‘confluence’, or an unusual pattern of wind flows, we can expect 800mm or more in a day. That is inevitable and has happened in other areas in the north on rare occasions. The Cuttens recorded 760mm in a 36-hour period in 1911 which is near to a record.
The wettest month on record is January 1981 when almost 2.5 metres of rain fell; in only two weeks, we had 2.1 metres. The second heaviest month on record is February 1984 with 1.6 metres.
Dunk Island had rainfall readings recorded by the Bureau of Meteorology for 52 years from 1973 until 2015 and the average annual rainfall was 2,834mm, only 236mm less than the average recorded at the Bingil Bay station.
Statistical tests of the Bingil Bay station data show there are no signs of the rainfall pattern at Mission Beach changing, but 95 years is a too short to know.


The average monthly rainfall pattern is shown in this chart tracking rainfall and number of rainy days:
Some comparisons are offered here to place our rainfall averages in perspective:
- Tully claims the highest average rainfall for an Australian town, but Babinda is higher at 4,259mm pa with Tully at 4,067mm. Bellenden Ker (252 people), north of Babinda, is wetter with an average of 4,641mm pa. Innisfail Wharf averages 3,097mm pa, similar to Mission Beach.
- The wettest place in Australia is the top of Mt Bellenden Ker: 8,093mm pa average.
- The wettest place on Earth is Mawsynram in India (between Bhutan and Bangladesh) at 11.9 metres average pa; Cherrapunji nearby has recorded 26.4 metres in a year.
- The Bureau planned to install an automated weather station for Mission Beach, like the one in Cardwell, but it did not happen. There are long distances between BoM weather stations in our region compared to the rest of Queensland. Cardwell has only 2,100mm pa rainfall; it is not a similar climate to Mission Beach. South Johnstone has an auto station as well.
- A rain radar is needed between Townsville and Cairns because the accuracy of predictions drops off at a distance. Builders and tourist operators need good forecasting data, not just farmers.
The history of cyclones in our district is also interesting.
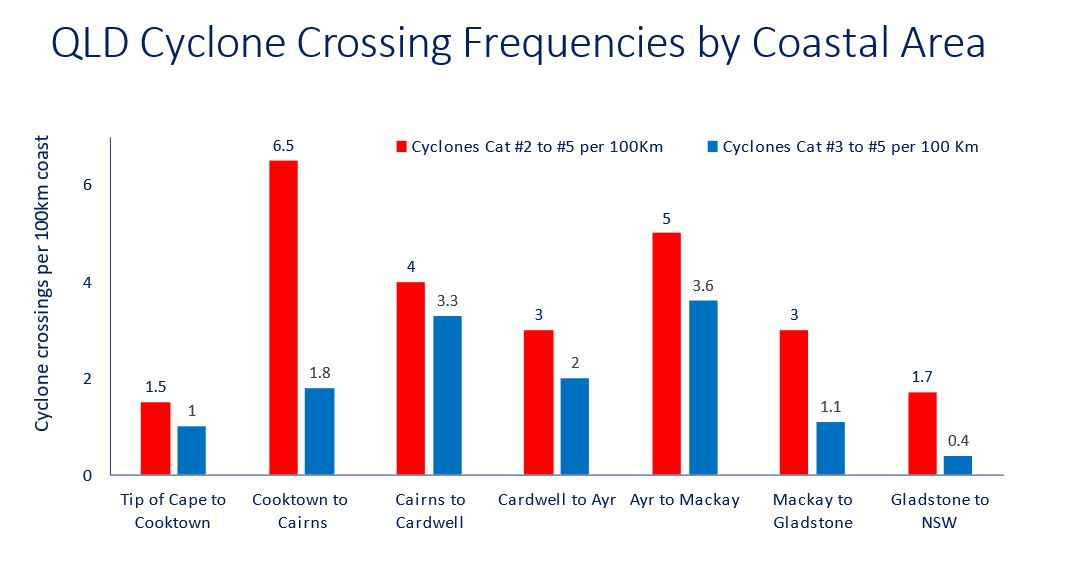
The area from Cairns to Cardwell has seen six severe cyclones (category #2 to #5) cross the coast since records were first kept in 1858 (173 year history). Five of those were of category #3 or higher. A chart (next page) shows the frequency of severe cyclone crossings per 100km coastline in different areas.
This region has had fewer cat#2 to cat#5 crossings per 100km coastline than Cooktown to Cairns or Ayr to Mackay, but when we get cyclones, they tend to be heavy duty ones, cat#3 and above.
Our cyclones: 1882 (cat #2, crossed at Cardwell), 1890 (cat #3 Cardwell, 1918 (cat #5, Innisfail); 1986 (Winifred, cat #3, Cowley), 2006 (Larry, cat #4, Innisfail) and 2011 (Yasi, cat #5 Mission Beach.)
The biggest Queensland cyclone in European history was in 1899 (Cyclone Mahina, Princess Charlotte Bay). The next biggest was the 1918 cyclone (crossed at Innisfail) then 2011, Yasi (Mission Beach).
The wettest months on record are shown in the chart below:
The most recent record broken was in May 2022. While the overall rainfall pattern has not significantly changed it is of interest to note that 10 of the 12 monthly records have been set in the 48 years from 1974 to 2022 while only two records are recorded for the 48 years from 1925 to 1973.
|
Download PDF |
